I am a statistician by training and experience. A common problem with people is to project causation on a random association (often of thousands possible) that agrees with ideological beliefs or doctrines. In this post, I will look at the dramatic increase of autism through the eyes of statistican. I will not be documenting the shyte out of things, just hitting highlights with many borrowed graphics.
The Reality
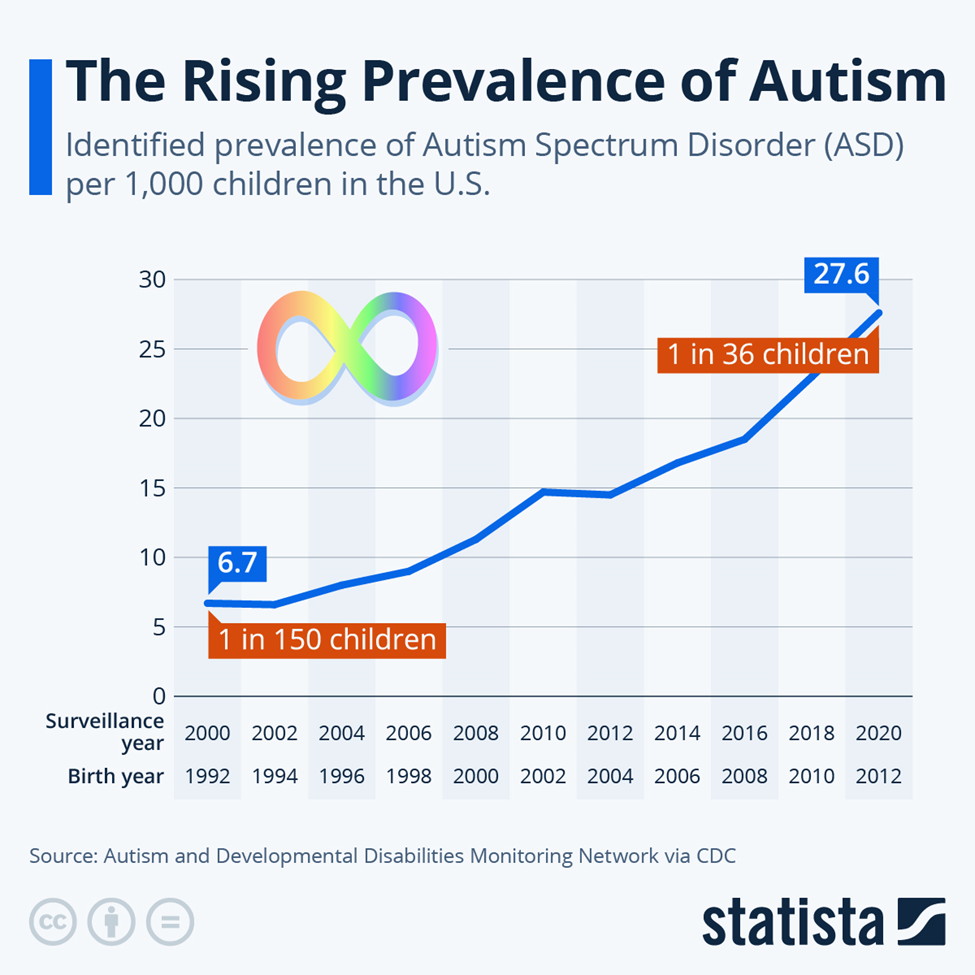
Before the 1960s, autism was considered a very rare condition, with prevalence estimates around 0.05% (1 in 2,000 children). This contrasts with recent estimates, which are significantly higher. Some studies from the 1960s and 70s reported prevalence rates between 2 and 4 cases per 10,000 children.
Vaccines
First, a 2025 study Large Danish Study: No link between vaccines and autism or 49 other health conditions using data from a national medical system (i.e. uniformity of treatment and records) with a high degree of uniformity in nutrition and other compounding analysis issues — effectively should end this red-herring that is popular in MAGA groups
Simple Culture Changes
A few years ago I wrote Autism Factors where I reviewed what was found to be very statistically significant including the following:
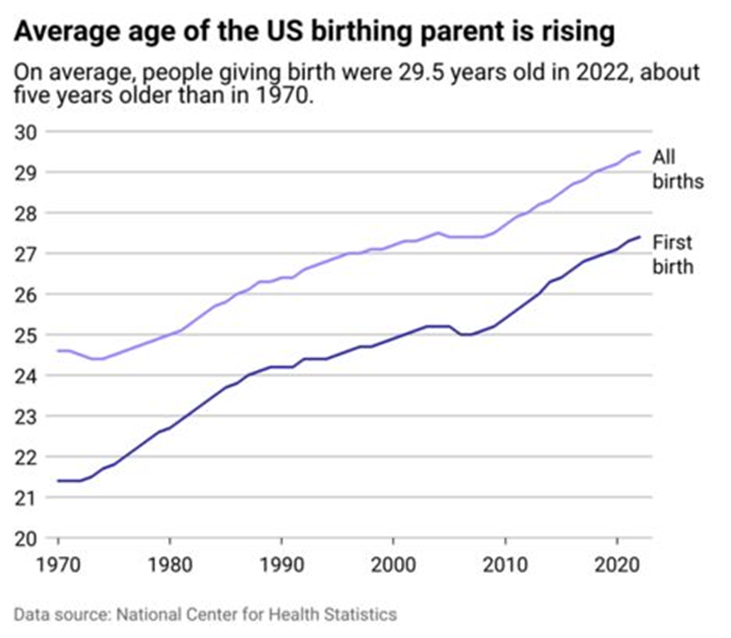
- Age of mother
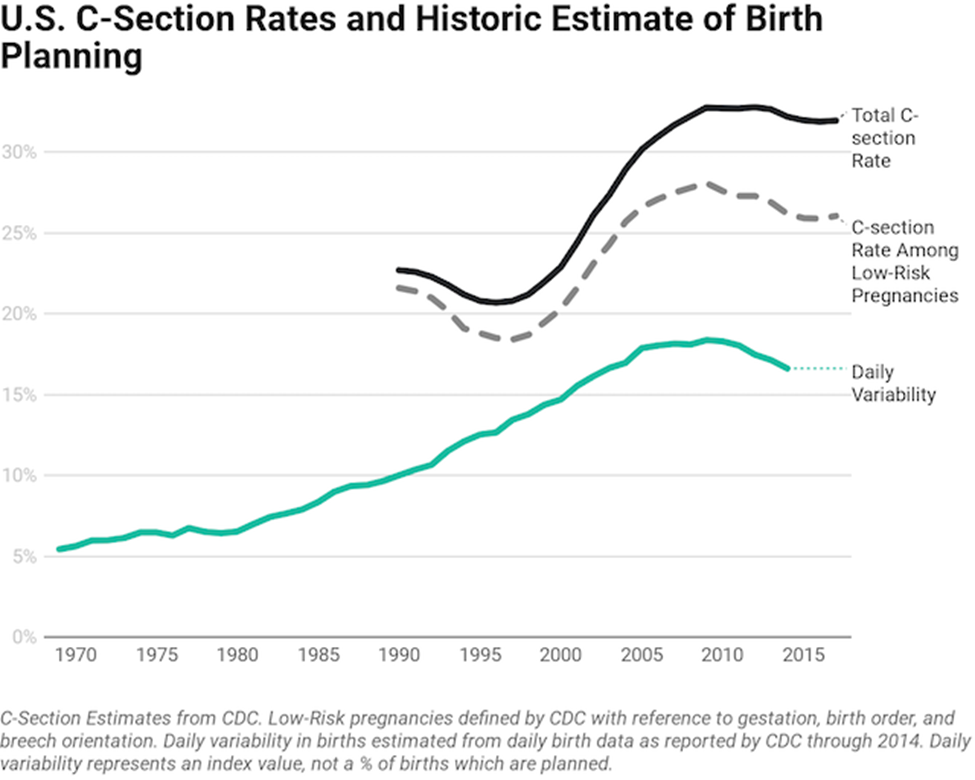
- Caesarean delivery
- Breast Feeding
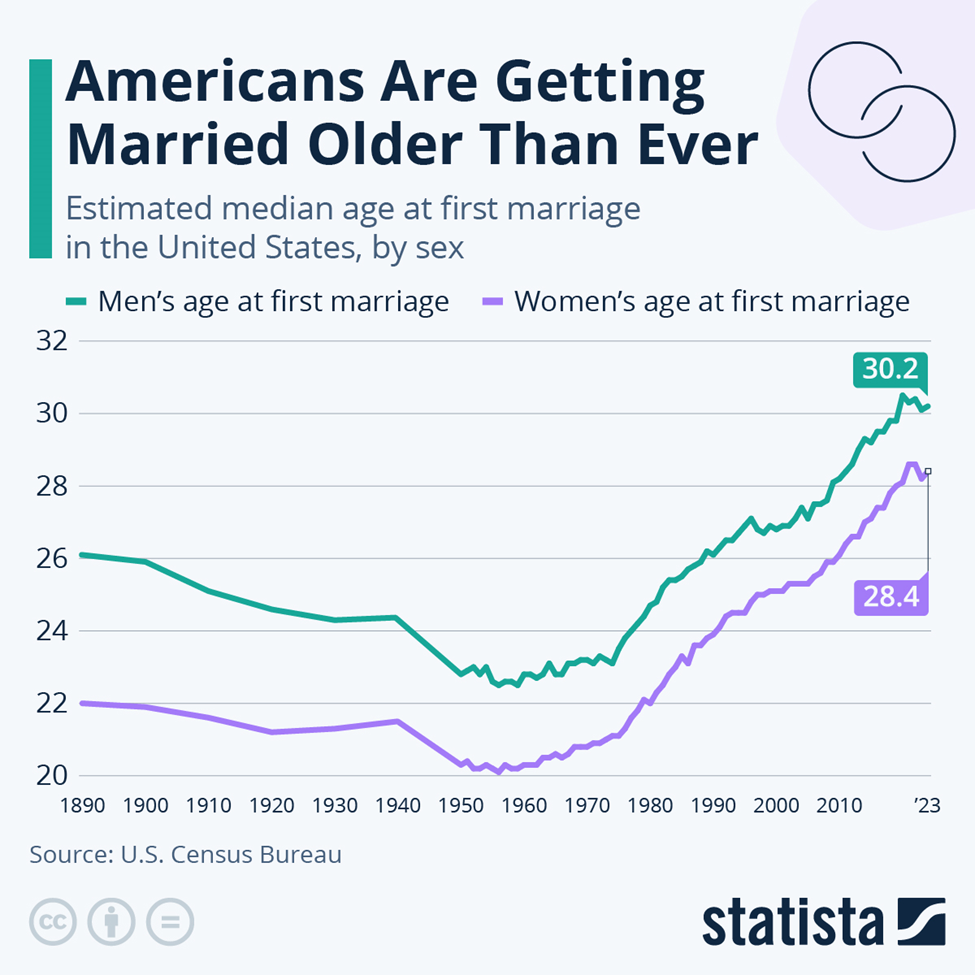
Marrying Older means more Autism
The increase of age shown below follow the above curve well!
We also see that in age of birthing parents. Notice that both above and below, we have a flatening around 2010.
Looking at C-Sections, we seem more matching of patterns. Also breastfeeding decreases risk of autism.
Less Kids –> More Autism
Studies have revealed that the odds of a first child having autism is 160% of the chance of a second child. As the number of kids decrease, the number of kids with autism will increase. Assuming that everyone has one kid and 16/1000 has autism. With an average of 4 kids, it should drop to 11/1000. That is a 32% drop in the rate of autism
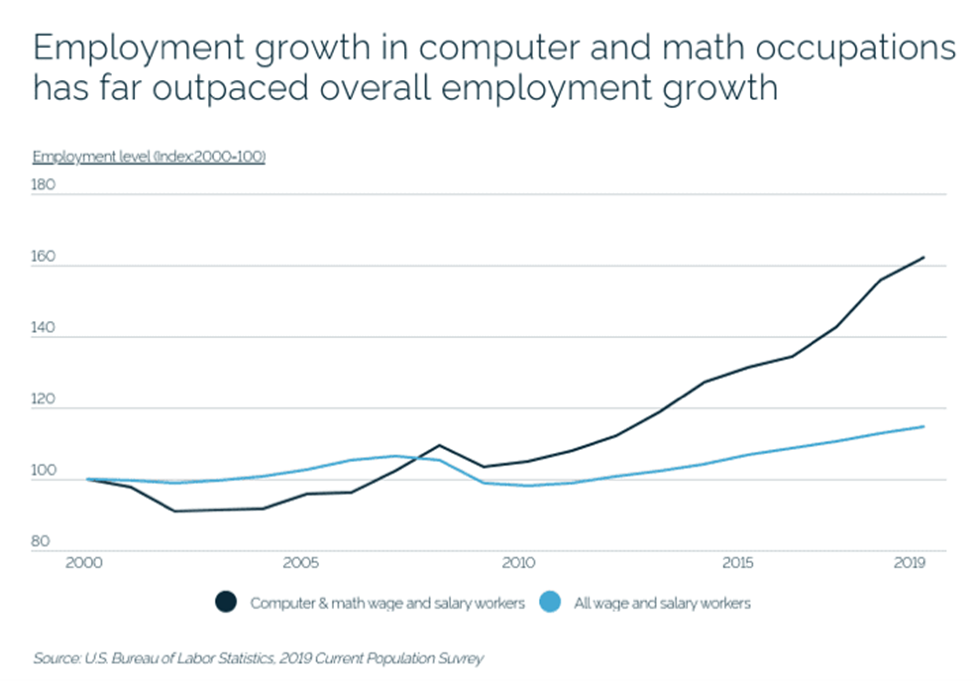
“Inbreeding”
Additional studies found increase incidence when both parents are involved with mathematics and computers. It has been suggested that DNA mutation that allows people to be successful in those occupations effectively increased the odd of an “in-breeding like” child. One mutation is fine, matching mutations is horrible.
Environmental Factors
The chart below makes this potential clear. “We found the previously reported relationship between precipitation and autism in a county was dependent on the amount of drinking water derived from surface sources in the county.” [2012]
Looking at some factors
PFAS-contaminated water or food is strongly associated: “Longitudinal study links PFAS contamination with teas, processed meats and food packaging“. This leads to this report: Autism rates declining among wealthy whites, escalating among poor. Wealthy whites are more prone to eat organic, avoid fast and processed foods.
The study, published Thursday in the Journal of Autism and Developmental Disorders, raises the possibility that parents in wealthier counties are successfully reducing environmental exposures that may contribute to autism risk, or taking other steps to curb its severity early on.
This leads on a last factor, the microbiome: Bacteria Associated with Autism from Microbiome Prescription, or if you prefer, Studies on the US National Library of Medicine. Bacteria is strongly associated to diet, i.e. processed meats and food additives to name a few.
Bottom Line
Autism is not purely genetic in a strict sense (if may be a significant factor), but age of birth, birth order, mother’s environmental issues are significant factors. All of these are “before the fact” issue. The best options for “after the fact” appear to be:
- Environment
- Microbiome manipulation
Concerning drugs, most drugs alter the microbiome and it is unclear if the drug is directly causing improvement, or indirectly by altering the microbiome.
The data that tend to follow or correlate alongside autism rate—meaning demographics, diagnostic trends, or related variables often tracked or reported with autism prevalence—include:
- Age: Autism diagnoses are most commonly made in early childhood, especially between ages 2 and 8. Prevalence estimates are often reported for specific age cohorts, such as age 4 or 8, which the CDC uses for tracking trends.
- Sex: A consistent male predominance is reported, usually about a 4-to-1 male-to-female ratio in childhood diagnoses. However, recognition of autism in girls lags behind, with many women diagnosed much later, suggesting under-identification in females.
- Race/Ethnicity: Rates of diagnosis have historically been higher in white children, but recent data show increases among children of color as diagnostic access and awareness grow.
- Socioeconomic Status: Diagnosis rates may connect to family income, healthcare access, and parental education, but increasing prevalence in different demographics may reflect better awareness and diagnostic efforts rather than true increases in incidence.
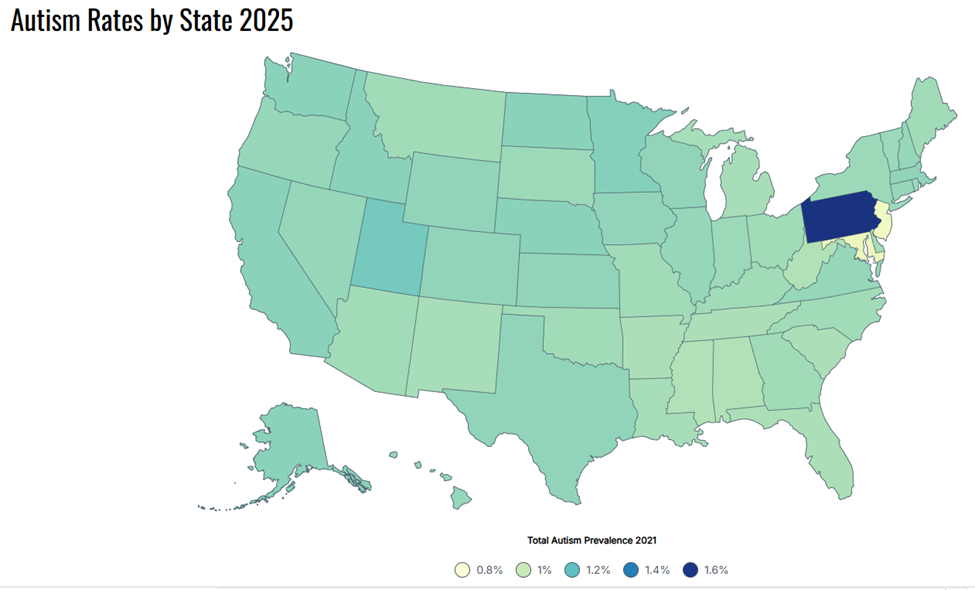
- Geography: Autism prevalence varies by region and state, partly due to differences in healthcare systems, special education reporting, and diagnostic practices.
- Method of Case Finding: Surveillance approaches (e.g., school/education records, medical billing data, or direct assessment) influence reported rates. Records-review surveillance and direct assessment generally yield higher prevalence than administrative counts.
- Comorbid Conditions: Many studies note higher rates of intellectual disability, ADHD, anxiety, or other neurodevelopmental issues reported in those diagnosed with autism.
- Time: Time trends are a key data point. Autism prevalence has risen substantially since the 2000s, largely attributed to broader diagnostic criteria, greater awareness, and increased screening—not necessarily a true rise in underlying incidence.
- Diagnosis Age and Early Identification: Data often track the percentage of children diagnosed by a certain age, as early diagnosis is important for access to services.