This is an exploration post on three autism microbiome samples (all were processed on Thryve, two had their FASTQ files processed on BiomeSight.com for a second interpretation of the bacteria present). I will follow the analysis pattern that I used for myself in this post, Microbiome Outliers.
The three samples are:
- A – Autism
- B – Autism
- C – Diagnosed as ASD, main characteristic is speech delay (been there, done that personally)
- D – Diagnosed as ASD, then PANS/PANDA and possible Mast Cell issues. Unfortunately – this was done by BiomeSight and not Thryve, so not exactly comparable (See The taxonomy nightmare before Christmas…)
Remember this is experimental, possibly 10 years ahead of conventional medicine – and will likely be subject to evolution. It is the best that I am aware of (and gladly be informed of better!). It will give three ‘samples’ to compare other autism microbiome against.

Core Supplements Suggested
There appears to be no shared pattern here. I usually look at items below 5% or above 95% (Outliers). What is an outlier for one child is not an outlier for the other child.
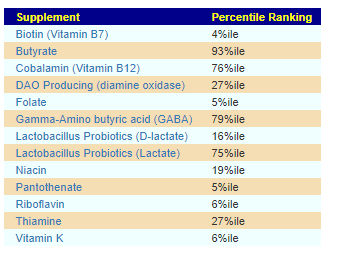
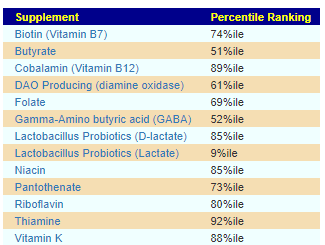
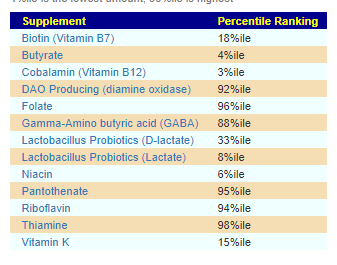
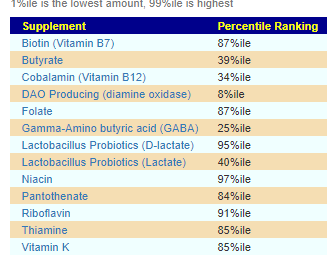
For D, the low DAO production could present appearing to be a Mast Cell issue (That is not an actual issue with Mast Cells, instead low DAO)
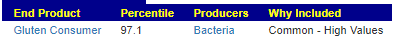
End Product Outliers
Again, we find no shared patterns.
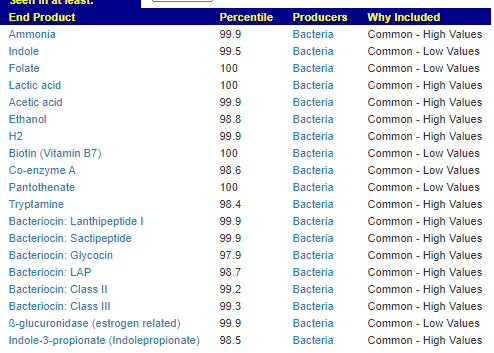
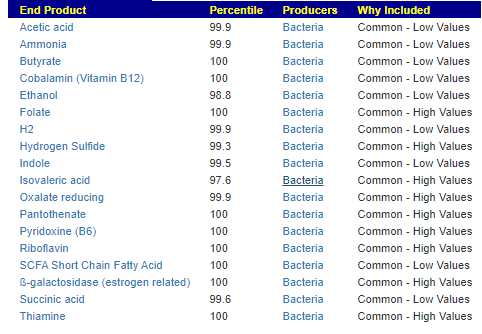
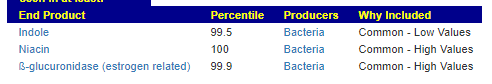
We see 3 children share low Indole levels. Note: The amino acid tryptophan is an indole derivative and the precursor of the neurotransmitter serotonin.[2]
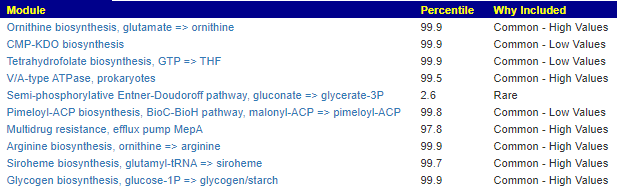
KEGG Module Outliers
To put this simply, Modules are a complex of processes.

Kegg Enzyme Outliers
This looks at enzymes produce by the bacteria. There are many, many enzymes – far more than is commonly known.
Here we have a reversal between A and B. Above, B shows few abnormalities and A shows many abnormalities. With the enzymes, B jumps ahead of A by a long distance! B has 453 items, A just 51.
There were no items that both had.
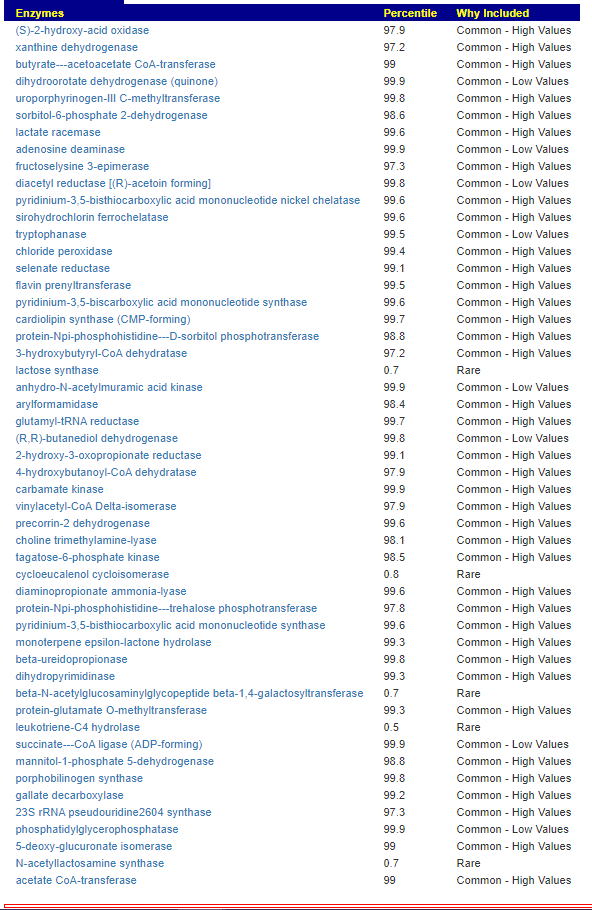
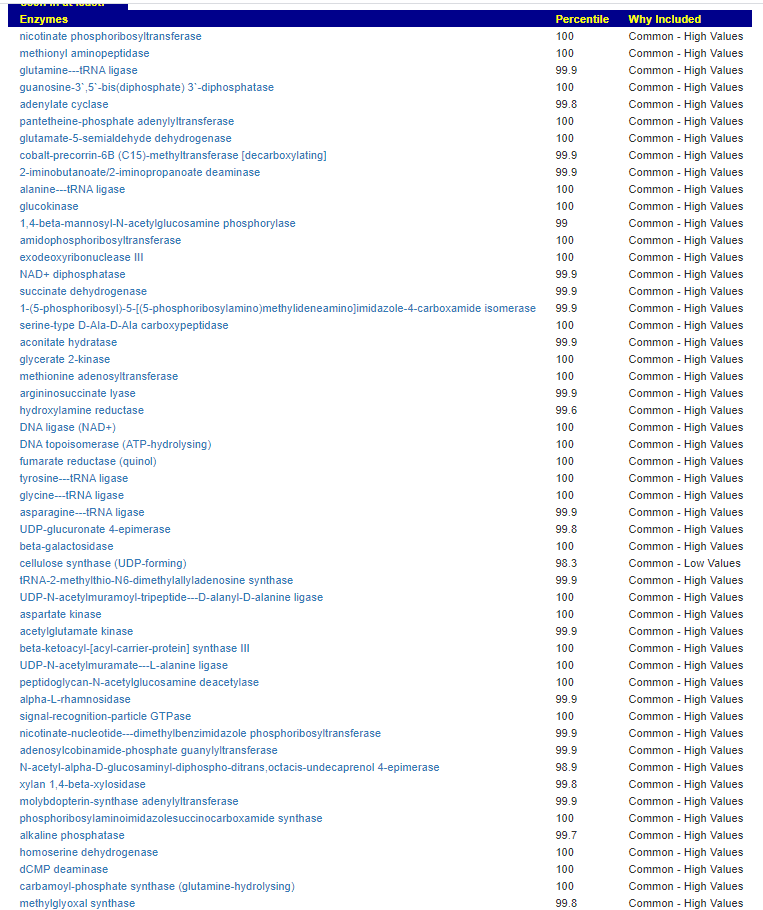
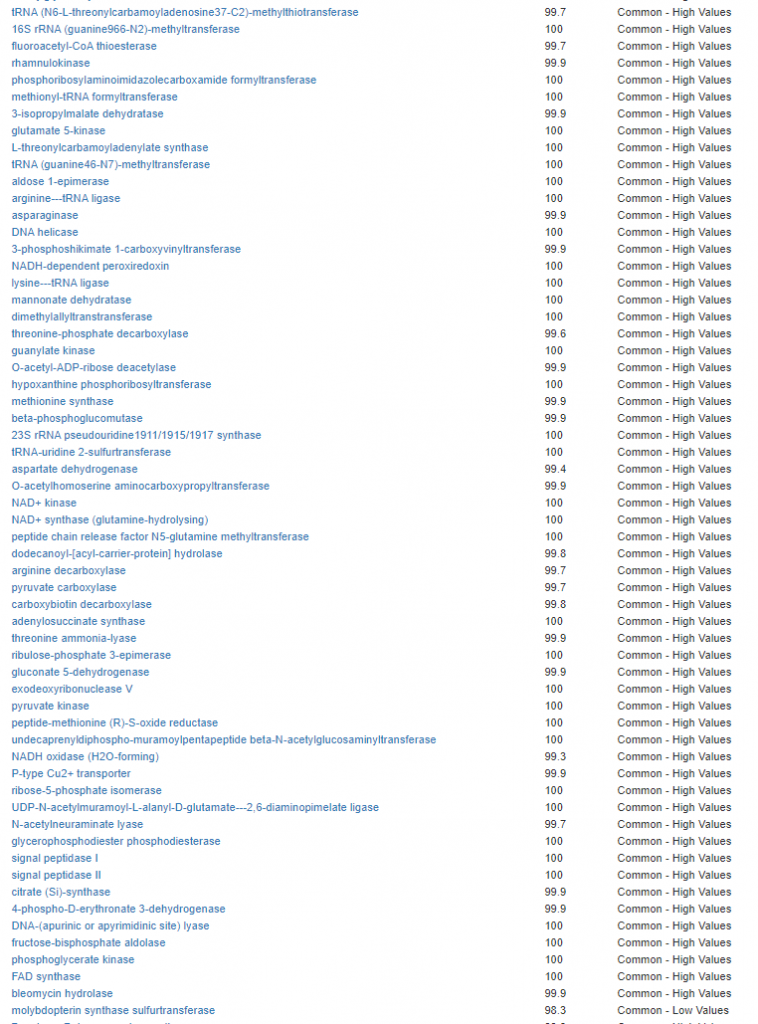
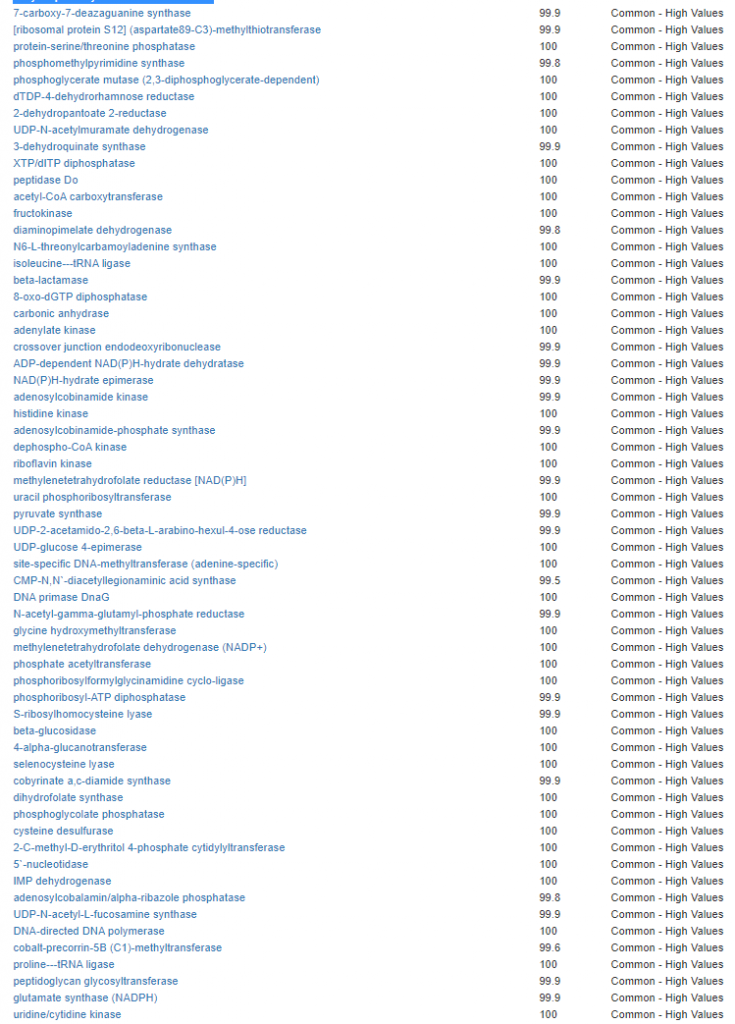
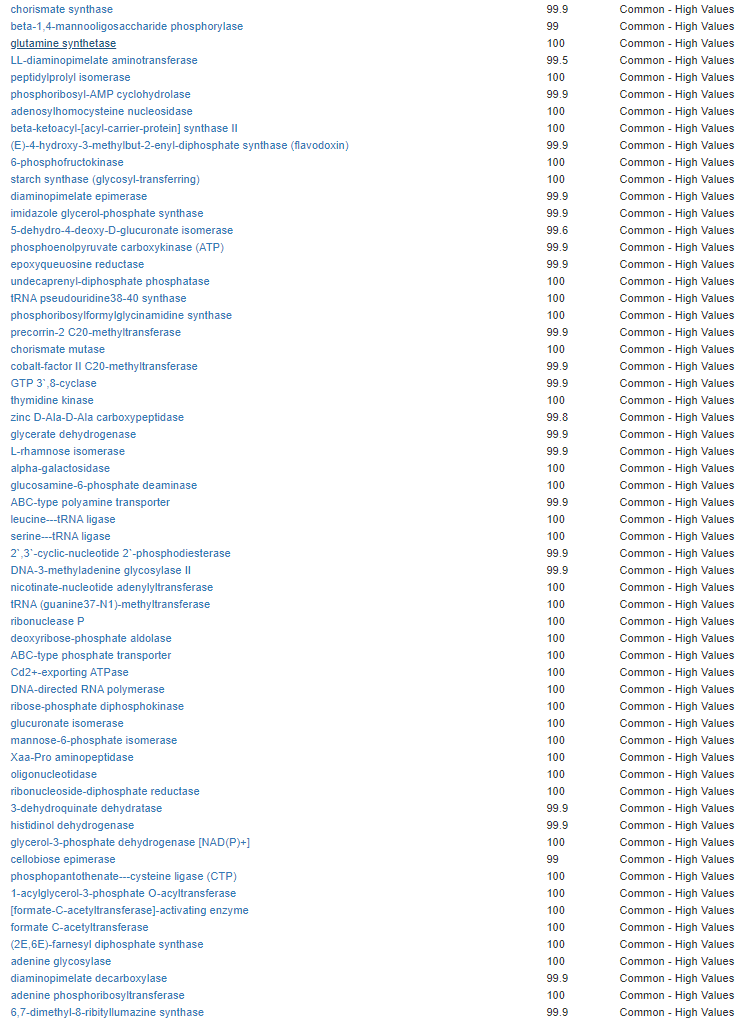
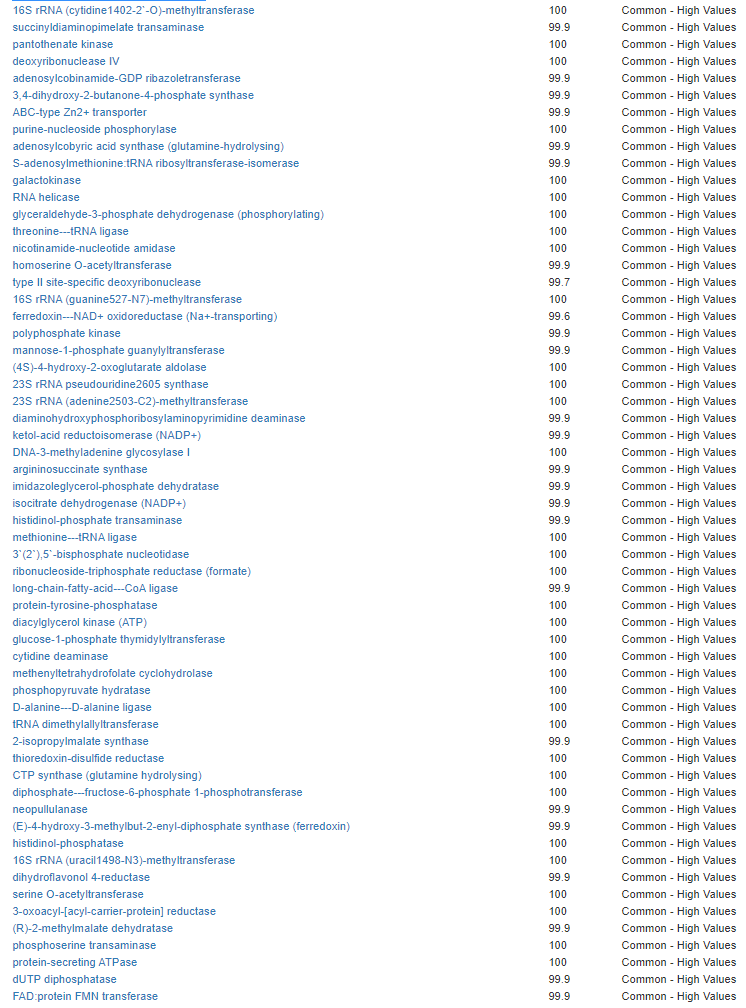
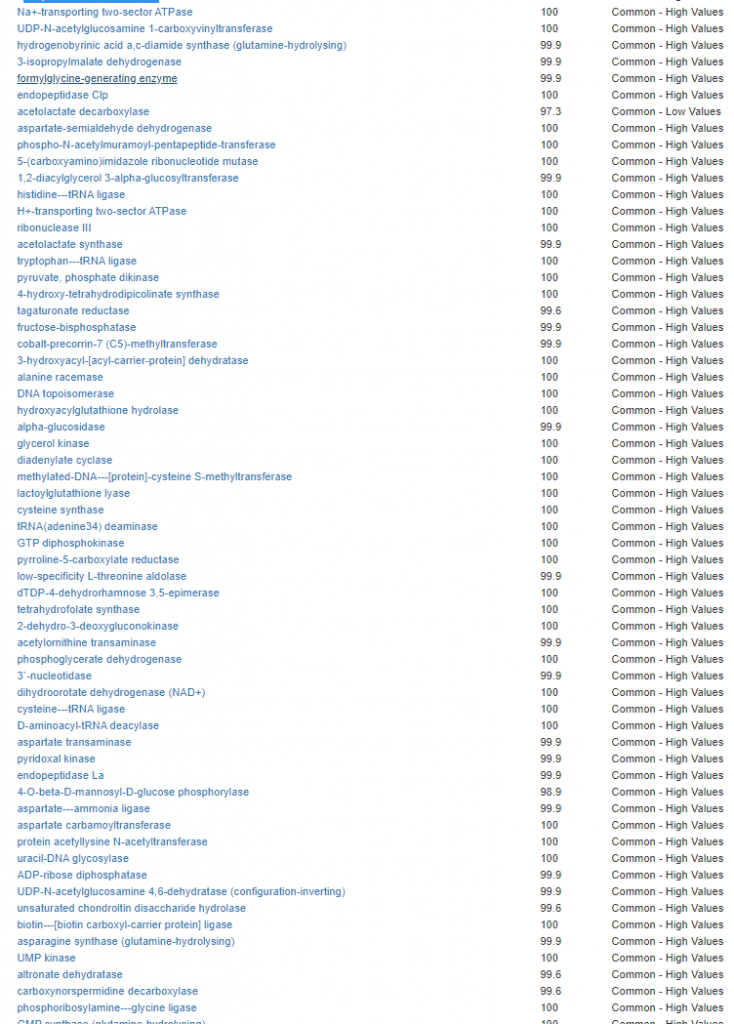
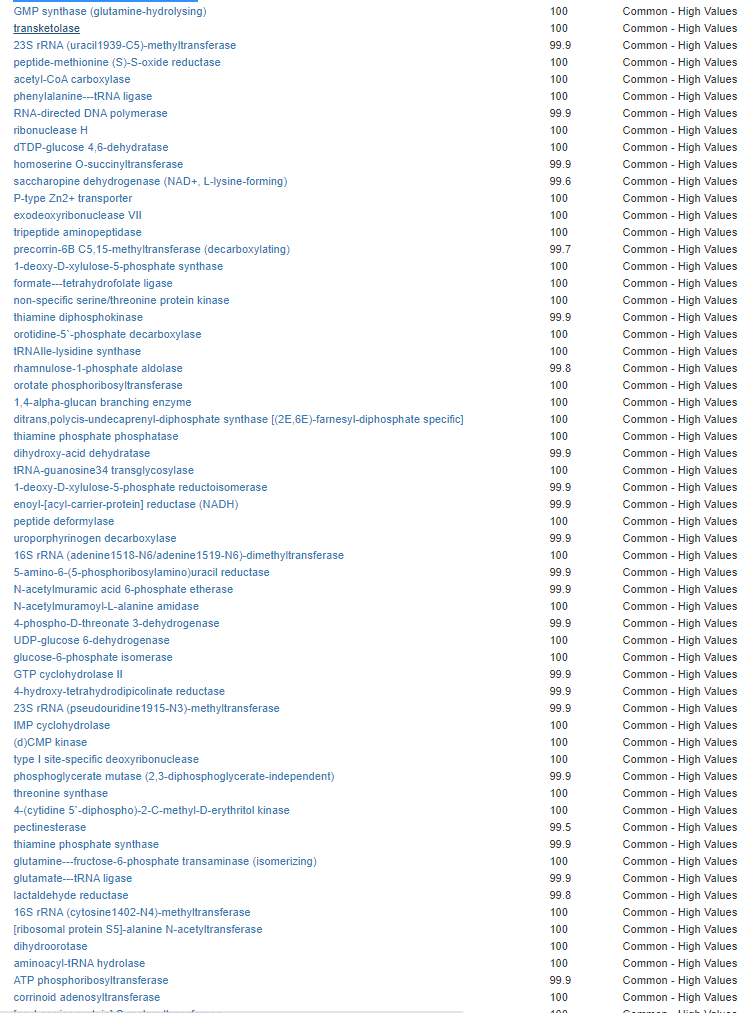
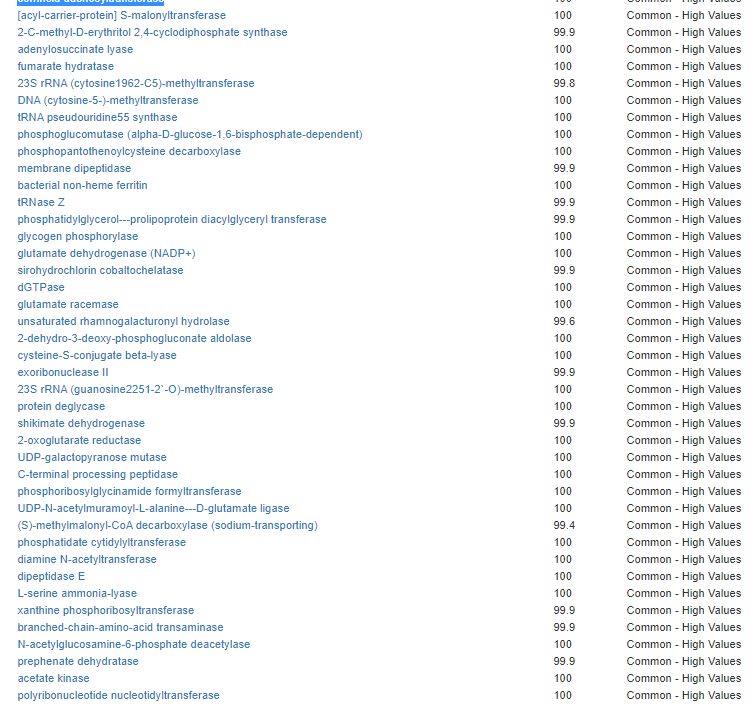
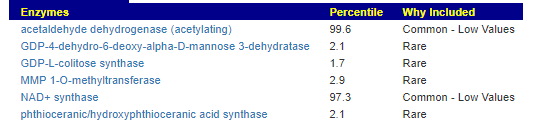
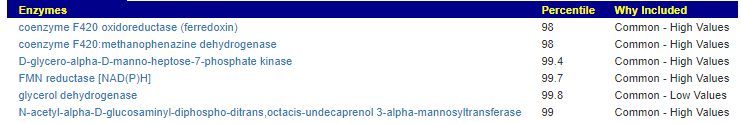
It is interesting to note that both children with ASD have very short lists here.
Bottom Line
Until I hit the Enzymes, I was coming to the impression that A has a jacked microbiome and B did not. That was suddenly changed when I looked at the Enzymes, B had a massive number of different shifts.
C and, who has an ASD diagnosis with speech issues being the main issue (not behavior issues etc). We see just 2,5 (versus 53 versus 451) enzyme outliers using Thryve data. This hints at enzyme production dysfunction by the microbiome as an area of interest for more severe autism.
Note: Getting suggestions from enzyme outliers or KEGG Module are features on my backlog. It will be complex to implement well.
If you look at my own latest results, Microbiome Outliers, the only thing that I had was “Rare” which could be ascribed to noise (incompleteness) of the lab results.

I did look at their results with BiomeSight processing too. They are roughly similar (we have a lot less samples – less than 10% of samples, so those results are more volatile/unreliable to compare against our sample population – Thryve is the better choice of lab solely because we have more samples uploaded. Please process their FASTQ files thru biomesight.com to build our sample population ).
Post coming soon a three way family comparison – Parent, ASD child, non ASD child. Drilling down across all data. It will be a long post.