New Features – Autism Children

This is an exploration post on three autism microbiome samples (all were processed on Thryve, two had their FASTQ files processed on BiomeSight.com for a second interpretation of the bacteria present). I will follow the analysis pattern that I used for myself in this post, Microbiome Outliers.

The three samples are:

  • A – Autism
  • B – Autism
  • C – Diagnosed as ASD, main characteristic is speech delay (been there, done that personally)
  • D – Diagnosed as ASD, then PANS/PANDA and possible Mast Cell issues. Unfortunately – this was done by BiomeSight and not Thryve, so not exactly comparable (See The taxonomy nightmare before Christmas…)

Remember this is experimental, possibly 10 years ahead of conventional medicine – and will likely be subject to evolution. It is the best that I am aware of (and gladly be informed of better!). It will give three ‘samples’ to compare other autism microbiome against.

Where we get this information on http://microbiomeprescription.com/

Core Supplements Suggested

There appears to be no shared pattern here. I usually look at items below 5% or above 95% (Outliers). What is an outlier for one child is not an outlier for the other child.

A-Thryve
B-Thryve
C – ASD/Speech
D – ASD/PANDA/Mast Cell

For D, the low DAO production could present appearing to be a Mast Cell issue (That is not an actual issue with Mast Cells, instead low DAO)

End Product Outliers

Again, we find no shared patterns.

A- Thryve
B – Thryve
C – ASD / Speech
D – ASD/PANDA/Mast Cell

We see 3 children share low Indole levels. Note:  The amino acid tryptophan is an indole derivative and the precursor of the neurotransmitter serotonin.[2]

KEGG Module Outliers

To put this simply, Modules are a complex of processes.

A – Thryve
B- Thryve
NONE for C – ASD/Speech
None for D either -ASD/PANDA/Mast Cell

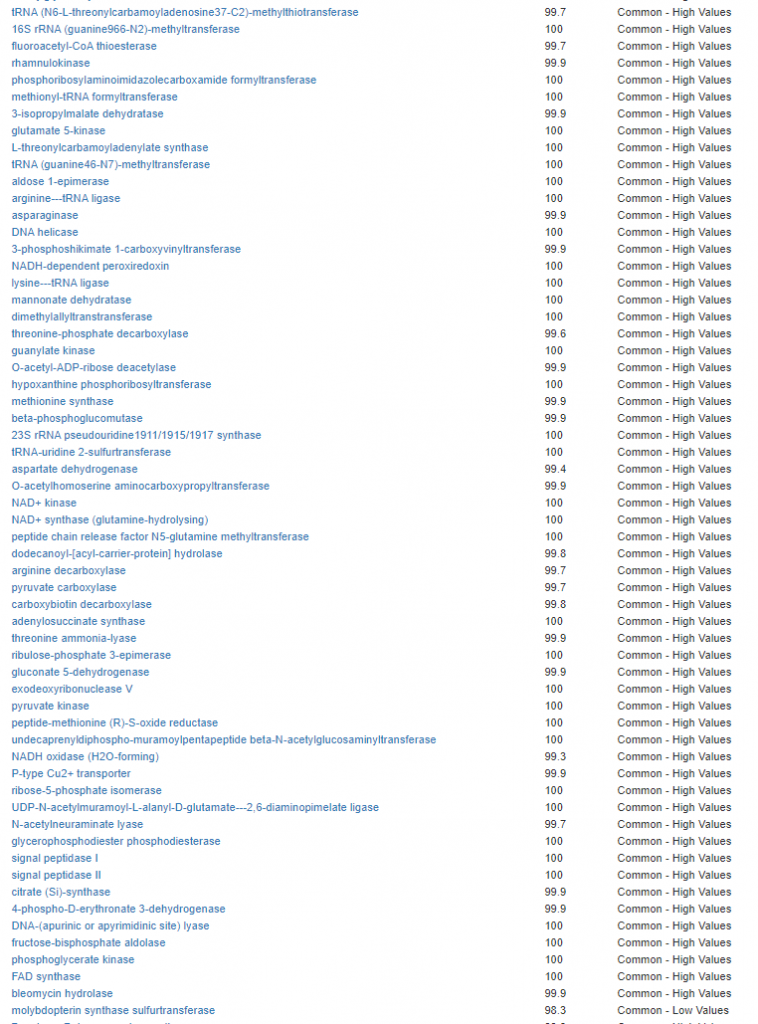
Kegg Enzyme Outliers

This looks at enzymes produce by the bacteria. There are many, many enzymes – far more than is commonly known.

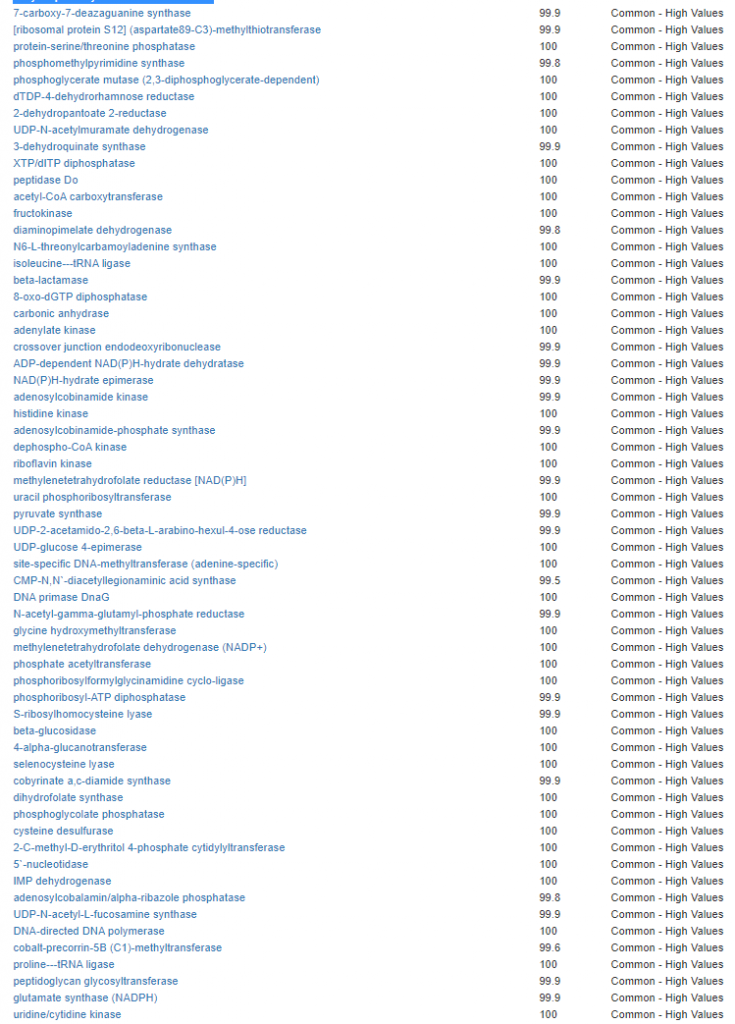
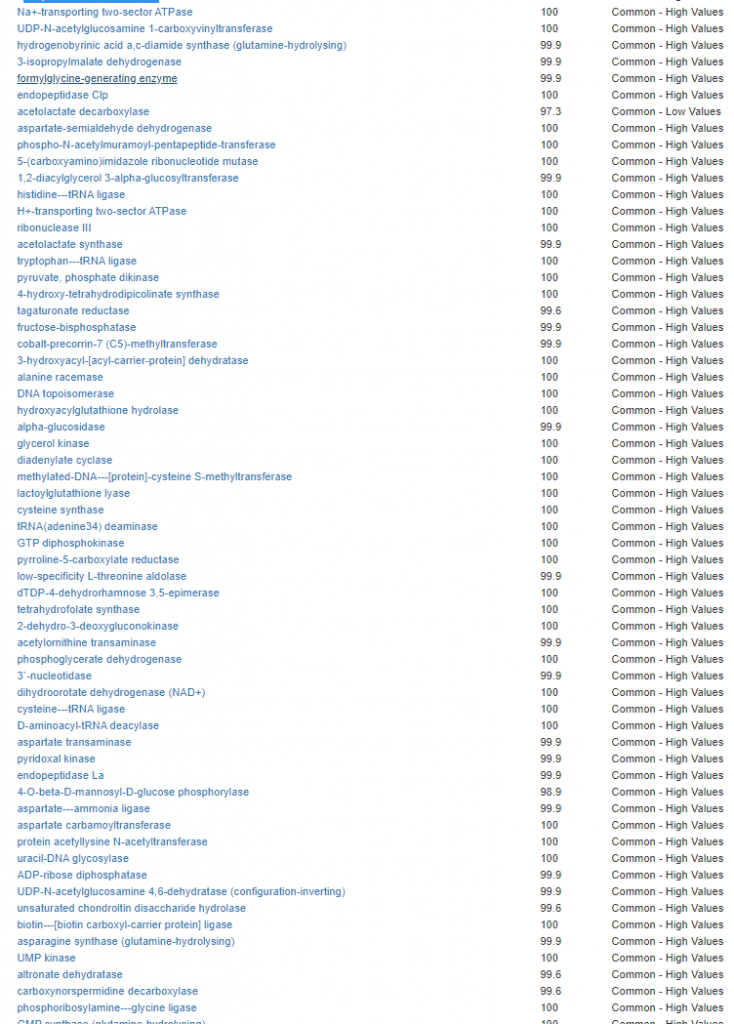
Here we have a reversal between A and B. Above, B shows few abnormalities and A shows many abnormalities. With the enzymes, B jumps ahead of A by a long distance! B has 453 items, A just 51.

There were no items that both had.

A – Thryve
B – Thryve: First Page
B – Thryve: Page 2
B – Thryve: Page 3
B – Thryve: Page 4
B – Thryve: Page 5
B – Thryve: Page 6
B – Thryve: Page 7
B – Thryve: Page 8
C – ASD/Speech
D – ASD / PANDA / Mast Cells

It is interesting to note that both children with ASD have very short lists here.

Bottom Line

Until I hit the Enzymes, I was coming to the impression that A has a jacked microbiome and B did not. That was suddenly changed when I looked at the Enzymes, B had a massive number of different shifts.

C and, who has an ASD diagnosis with speech issues being the main issue (not behavior issues etc). We see just 2,5 (versus 53 versus 451) enzyme outliers using Thryve data. This hints at enzyme production dysfunction by the microbiome as an area of interest for more severe autism.

Note: Getting suggestions from enzyme outliers or KEGG Module are features on my backlog. It will be complex to implement well.

If you look at my own latest results, Microbiome Outliers, the only thing that I had was “Rare” which could be ascribed to noise (incompleteness) of the lab results.

I did look at their results with BiomeSight processing too. They are roughly similar (we have a lot less samples – less than 10% of samples, so those results are more volatile/unreliable to compare against our sample population – Thryve is the better choice of lab solely because we have more samples uploaded. Please process their FASTQ files thru biomesight.com to build our sample population ).

Post coming soon a three way family comparison – Parent, ASD child, non ASD child. Drilling down across all data. It will be a long post.

Organic Acid Tests (OATS) and Autism #4

This is a continuing series of blogs looking at OATS results and autism. The goal is to filter out items that are relevant to autism. The series is not intended to do a full explanation of the OATS test or a single person’s result. The OATS test is not autism specific but general health (often IBS/FM/CFS focuses).

Remember that our knowledge is constantly changing (unfortunately most MDs knowledge of the literature is stale).

Panel A

  • 3-Hydroxybutyric
    • “Furthermore, levels of 3-hydroxybutyric acid and melatonin were significantly lower [in ASD] ” [2020] [2018] In this case not.
  • Acetoacetic – nothing explicit [2018][2019]
  • 4-Hydroxybutyric (gamma-hydroxybutyric acid) – high levels may be associated to specific DNA. [2019] [2016] [2009]
  • Ethylmalonic
    • ” ethylmalonic acid (P = 0.043) were significantly elevated in individuals with ASD.” [2020] – in this case not
  • Methylsuccinic – nothing found
  • Adipic – again, this child is normal range
    • ” the increase in adipic acid concentration was significantly and indirectly correlated with the severity of the deficit in socialization and communication skills in children with an ASD” [2016]
    • ” Overall, no increase in the concentration of adipic acid in children with ASDs compared to TD children, however when considering vitamin B supplementation in ASD there were significantly increased level of urinary adipic acid in children with an ASD not taking vitamin B supplementation compared to supplemented children or to TD children. ” [2016]
    • B vitamin supplementation reduces excretion of urinary dicarboxylic acids in autistic children [2011] B vitamins lowers
    • Significant differences were found between the autistic children and the control group in organic acids: 2-oxoglutaric, isocitric, citric, 4-hydroxybenzoic, 4-hydroxyphenylacetic, hippuric, adipic, suberic (all with p<0.05). [2011]
  • Suberic
    • “No significant difference were observed in suberic acid. ” [2016]
  • Sebacic – nothing found

Panel B

Suggested reading Supplements and Autism and Factors associated with Autism
  • Vitamin B12
    • “For example, levels of vitamins B1, B6, B12, A and D are often reported to be low in ASD children. ” [2020]
  • Vitamin B6
    • “For example, levels of vitamins B1, B6, B12, A and D are often reported to be low in ASD children. ” [2020]
  • Vitamin B5
    • “Based on semi-blinded assessment, the treatment group, compared to the non-treatment group, had significantly greater improvement in autism symptoms and developmental age. The treatment group had significantly greater increases in EPA, DHA, carnitine, and vitamins A, B2, B5, B6, B12, folic acid, and Coenzyme Q10. ” [2018]
  • Vitamin B2
    • “Based on semi-blinded assessment, the treatment group, compared to the non-treatment group, had significantly greater improvement in autism symptoms and developmental age. The treatment group had significantly greater increases in EPA, DHA, carnitine, and vitamins A, B2, B5, B6, B12, folic acid, and Coenzyme Q10. ” [2018]
  • Vitamin C
  • CoQ 10
    • “Based on semi-blinded assessment, the treatment group, compared to the non-treatment group, had significantly greater improvement in autism symptoms and developmental age. The treatment group had significantly greater increases in EPA, DHA, carnitine, and vitamins A, B2, B5, B6, B12, folic acid, and Coenzyme Q10. ” [2018]
  • NAC
    • “We concluded that N-acetylcysteine is safe and tolerable, reduces hyperactivity and irritability and enhances social awareness in children with autism spectrum disorder. ” [2020]
  • Biotin
    • “Low levels of biotin, plasma glutathione, RBC SAM, plasma uridine, plasma ATP, RBC NADH, RBC NADPH, plasma sulfate (free and total), and plasma tryptophan; also high levels of oxidative stress markers and plasma glutamate.” [2011]

Organic Acid Tests (OATS) and Autism – #3

This is a continuing series of blogs looking at OATS results and autism. The goal is to filter out items that are relevant to autism. The series is not intended to do a full explanation of the OATS test. The OATS test is not autism specific but general health (often IBS/FM/CFS focuses).

Remember that our knowledge is constantly changing (unfortunately most MDs knowledge of the literature is stale). In going thru the literature, remember what is reported is the result of a group and may not apply to a specific child with autism. Each child has difference symptoms and thus different microbiome dysfunction.

The purpose of the literature review is to identify items that are recognized as autism associated and to know what to follow up on with your medical professional.

This article, A Metabolomics Approach to Screening for Autism Risk in the Children’s Autism Metabolome Project [2020] is worth a read.

Panel A

Glyceric

Nothing found

Glycolic

A low value is seen here and in disagreement with the literature

  •  Other metabolites increased are 3,4-dihydroxybutyric acid, glycolic acid and glycine, cis-aconitic acid; phenylalanine, tyrosine, p-hydroxyphenylacetic acid, and homovanillic acid [2014]

Oxalate

A high value is seen here and in agreement with the literature

  • Children with ASD demonstrated 3-fold greater plasma oxalate levels compared with reference and 2.5-fold greater urinary oxalate concentrations [2012]
  • Low oxalate diets have been tried with no published results [2020]

Lactic

Appears to be connected to anxiety. High levels are associated with brain fog and loss of executive function with other conditions. Child is high.

Pyruvic

Child is upward trending. The literature refers to the ratio being high, and in this case, the ratio appears to high. An appropriate goal would be to reduce lactic acid.

Panel B

Succinic

We see low values, the literature reveal that this may be connected to some SNPs in some.

Fumaric

Skipping – not abnormal and nothing clear in the literature.

Malic

This person is high. Nothing found in the literature.

2-Oxoglutaric

This person is slightly low.

This lead to a single study from [2011]: “Significant differences were found between the autistic children and the control group in organic acids: 2-oxoglutaric, isocitric, citric, 4-hydroxybenzoic, 4-hydroxyphenylacetic, hippuric, adipic, suberic (all with p<0.05).”

There was also “The ASD group had higher levels of phenylactic acid but decreased amounts of aconitic acid, phosphoric acid, 3-oxoglutaric acid, and carboxycitric acid compared to TD children. ” [2019]

Aconitic

This person is low.

This was also found low in the last study “decreased amounts of aconitic acid” [2019] and contrary results in ” Interactions among diet, intestinal flora and genes may explain such findings… Other metabolites increased are 3,4-dihydroxybutyric acid, glycolic acid and glycine, cis-aconitic acid; phenylalanine, tyrosine, p-hydroxyphenylacetic acid, and homovanillic acid are all involved in the tyrosine pathway leading to neurotransmitter cathecolamine.” [2014]

Citric

This person is slightly low.

“Three of 7 patients demonstrated abnormalities in citric acid metabolites, bacterial metabolism, and fatty acid oxidation markers. ” [2015] This implies abnormalities may only occur in a subset.

3-Methylglutaric

This person is slightly elevated.

” Metabolomic analysis of urinary organic acids revealed that three metabolites, 3-hydroxy-3-methylglutaric acid (P = 0.008), 3-methyglutaconic acid (P = 0.018), and ethylmalonic acid (P = 0.043) were significantly elevated in individuals with ASD.” [2020]

3-Hydroxyglutaric

Nothing found in the literature. Person is in normal range.

3-Methylglutaconic

Nothing found in the literature. Person is in normal range.

Bottom Line

We have done another section of the OATS report. Correcting by diet or drugs some of these shifts is another level of analysis; one that too-often there is little information on.

One known example: Pyruvic-Lactate ratio can be addressed by reducing the amount of lactic acid (i.e. no Lactobacillus probiotics, reducing food that produce lactic acid – milk, yogurt). It may also require 16s microbiome tests to determine which lactate producing bacteria are present (list here)

Organic Acids Tests (OATS) and Autism #2

This is a continuing series of blogs looking at OATS results and autism. The goal is to filter out items that are relevant to autism. The series is not intended to do a full explanation of the OATS test. The OATS test is not autism specific but general health (often IBS/FM/CFS focuses).

Remember that our knowledge is constantly changing (unfortunately most MDs knowledge of the literature is stale).

Panel A

Glutathione

In this test panel, we see that this it is well below the normal range.

the functional properties (such as galactose metabolism, glycosyltransferase activity, and glutathione metabolism) displayed significant differences between the ASD and HC groups. The current study provides evidence for the relationship between gut microbiota and ASD, with the findings suggesting that gut microbiota could contribute to symptomology.

Gut microbiota changes in patients with autism spectrum disorders [2020]
  • The role of glutathione redox imbalance in autism spectrum disorder: A review [2020] “, the existing data provide a strong background on the role of the glutathione system in ASD pathogenesis. Future research is necessary to investigate the role of glutathione redox signaling in ASD, which could potentially also lead to promising therapeutics.”
  • “N-acetylcysteine, which can be converted to glutathione” [2020] In prior post, NAC was found to help a subset.
  • Does infectious fever relieve autistic behavior by releasing glutamine from skeletal muscles as provisional fuel? [2013]
    • ” If glutamine released by fever rarely aggravates autistic behavior, why would supplemental glutamine?” i.e. direct supplementation of glutamine is not suggested.

Methylation

In this test panel, we see that this it is well above the normal range. There is a lot of literature dealing with methylation, so I have selected two recent studies dealing with the DNA aspect.

Ammonia

This person is low in Ammonia Excess. The literature suggests level may depend on subset:

  • Dysregulated amino acid metabolism, high ammonia and oxidative stress were prevalent among autistic children and should be considered in autism management [2020]
  •  Twenty-eight (38%) cases were positive for H. pylori antigen in their stool with significant higher serum ammonia and lower adenosine deaminase than in H. pylori-negative autistic children.  [2019]
  • “when concentrations of fecal acetic, butyric, isobutyric, valeric, isovaleric and caproic acids were measured, all were significantly higher in children with ASD compared with controls except for caproic acid. The concentration of fecal ammonia was also significantly greater in ASD participants than controls “[2012]

Aspartame, Salicylates and 2-Hydroxyhippuric returned no results.

Panel B

Summary of searches on PubMed for Autism with:

  • 2-Hydroxyisovaleric – nothing
  • 2-Oxoisovaleric – nothing
  • 3-Methyl-2-oxovaleric – nothing
  • 2-Hydroxyisocaproic – nothing
  • 2-Oxoisocaproic – nothing
  • 2-Oxo-4-methiolbutyric (Nothing found on this chemical on PubMed!!)
  • Mandelic – nothing
  • Phenyllactic and Phenylpyruvic – one research article on rats
    • “potentially explaining the origin of trans-indolylacryloylglycine, a postulated marker for autism.” [2012]
    • A low level could suggest “differences in the gut microbially‐mediated metabolism of phenylalanine”
  • Homogentisic – nothing
  • 4-Hydroxyphenyllactic – nothing
  • N-Acetylaspartic – nothing
  • Malonic – high levels seen at birth has increased risk of autism [2017]
  • 4-Hydroxybutyric – nothing

Phosphoric has some 43 search hits for phosphorus. The most significant items are below

  • “There was a significant correlation of levels of phosphorus and sulfur in the children with ASD” [2020] Higher –> Autism
  • Several articles cited the importance of phosphorus for Vitamin D

Section Summary

None of the lab’s measurement here are relevant to autism. They may be relevant to other health issue.

Bottom Line

We see that DNA is involved with the possibility of altering its behavior with supplements and/or microbiome alteration.

Organic Acids Tests (OATS) and Autism #1

The last of the test results forwarded by a reader was the Great Plains Laboratory Organic Acid Test. The two earlier tests results with comments are:

There are a lot of tables in this report and I will do just 1-2 in each blog post to keep information flow manageable.

This test is interesting because it lists some of the bacteria associated associated various markers.

This page lists OVERGROWTH — there is only one that is high (overgrowth). Items being low should likely be ignored.

The one interesting thing is that most of the lows are associated to Aspergillus. This agrees with a study that I cited earlier:

“Saccharomyces and Aspergillus showed significant differences between ASD (59.07%) and Control (40.36%), indicating that they may be involved in the abnormal gut fungal community structure of ASD. When analyzed at the species level, a decreased abundance in Aspergillus versicolor was observed while Saccharomyces cerevisiae was increased in children with ASD relative to controls. ” [2020]

 Aspergillus oryzae is the only Aspergillus that I know that is available as a probiotic (Strong Wakamoto W)

 2-Hydroxyphenylacetic Acid is shown as high above. The literature mentions 3-Hydroxyphenylacetic Acid is common with Autism

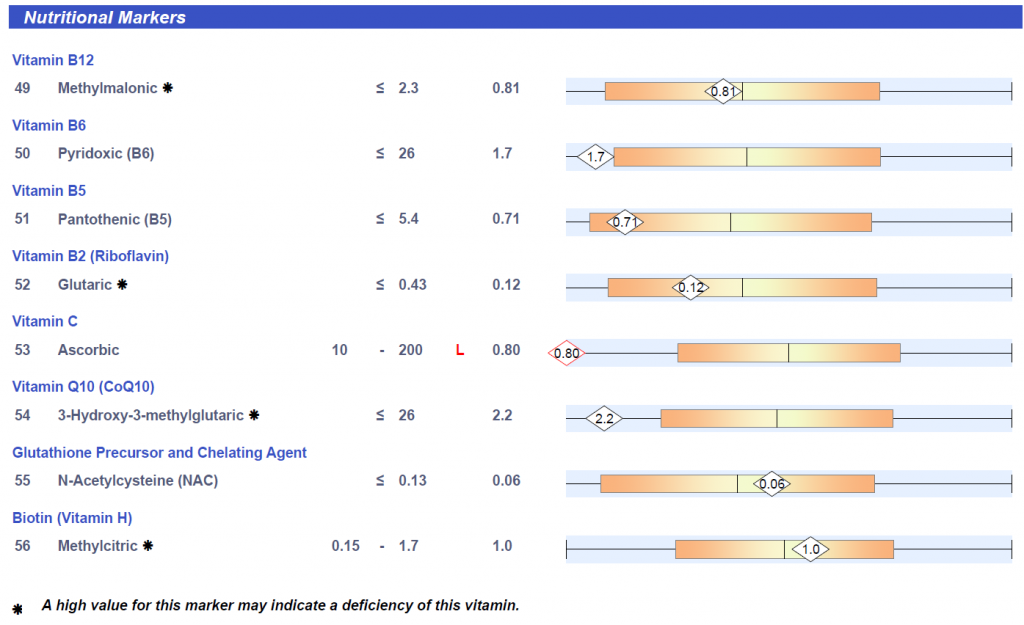
Nutritional Markers

The item that stands out is thiamin and there is no literature connecting it to autism beyond lower intake by diet in some locations.

  • Autism spectrum disorder group failed to meet dietary recommendations for thiamin, riboflavin, vitamin C, or calcium. [2017]

From this article Nutritional and metabolic status of children with autism vs. neurotypical children, and the association with autism severity [2011] we read:

  • No statistical difference for Thiamin
  • No statistical difference for Riboflavin
  • No statistical difference for Niacin
  • No statistical difference for Pantothenic Acid, but average was lower
  • No statistical difference for Vitamin C

I should add one word of warning, because the levels were similar, it does no exclude supplementation as being beneficial in some cases. The reason is that often they are processed into other chemicals (depending on available surplus and the bacteria present).

N-acetylcysteine (NAC) is more interesting because the marker indicate it was high. For a subset of ASD patients (high irritability), supplementation helps:

CoQ 10 is shown as low above. As with NAC, supplementation appears to benefit a subset.

Bottom Line

My working model is that symptoms are strongly associated to the metabolites (chemicals/vitamins) produced/processed by the microbiome (bacteria in digestive system). For CoQ10 and NAC, we know the bacteria that are likely impacted, and that information is linked to here (CoQ10 , NAC).

This means that it is not a one-size fit all approach to autism, but very individual – either based on symptoms OR on the microbiome. I am biased towards using the microbiome (16s reports from Biome Sight [“MICRO” as discount code], followed by Thryve Inside)

Parasitology and Autism

The same reader also included Doctor’s Data Comprehensive Stool Analysis / Parasitology x3. The results are below, and what I would expect to be common: Nothing detected. Toxoplasmosis plays an important role as a risk factor for autism, but not once autism is established [2020].

The test also reported on possible high Saccharomyces boulardii/cerevisiae, Klebsiella pneumoniae, and Proteus mirabilis.

  • “Saccharomyces and Aspergillus showed significant differences between ASD (59.07%) and Control (40.36%), indicating that they may be involved in the abnormal gut fungal community structure of ASD. When analyzed at the species level, a decreased abundance in Aspergillus versicolor was observed while Saccharomyces cerevisiae was increased in children with ASD relative to controls. ” [2020]
    •  Aspergillus oryzae is the only Aspergillus that I know that is available as a probiotic (Strong Wakamoto W)
  • Neither klebsiella pneumoniae nor Proteus mirabilis are reported in the literature as being significant for autism.

Declaration: I have little trust in the cfu/gram for detecting microbiome dysfunction. It is old school.

Bottom Line

Using this test for a child with autism is unlikely to produce productive results for most cases of autism. A 16s microbiome test (for example  Biome Sight with “MICRO” as discount code or Thryve Inside) would produce better information from newer technology at significantly less cost.

Minerals and Autism

A reader forwarded some lab reports and ask for comments. The reader gracefully gave permission to share some data to aid in the discussion and that others may benefit.

image.png
One child’s hair analysis

Connection to Microbiome

The absence or surplus of minerals impact both bacteria growth and the metabolites produced by the bacteria. An example study from 45 years ago illustrates this.

The effect of low levels of strontium, boron, lithium, molybdenum, and fluorine, alone and in combination, on hydroxyapatite solubility, bacterial growth, and acid production in five antigenic types of Streptococcus mutans was investigated…. The results show that low levels of strontium and fluorine can significantly reduce…

Effect of trace elements on dissolution of hydroxyapatite by cariogenic streptococci 1975

Antibiotic use is known to almost completely inhibit excretion of mercury in rats due to alteration of gut flora. [2019]

“During a pilot experiment, we found that germ-free mice [mice specially bred to have no bacteria anywhere in their systems] were resistant to anemia,” says Shah, senior author on the paper. “The easiest explanation is that you’ve gotten rid of a trillion bacteria and they no longer need iron. But interestingly, we saw that the iron absorptive mechanisms were all highly upregulated in the absence of microbiota.”

Gut Microbiome Puts the Brakes on Iron Absorption [2020]

Mineral Abnormalities in Autism

The microbiome influences the absorption and elimination of minerals. The minerals impacts the microbiome. In short, the microbiome will bias the mineral mixture in favor of what it prefers (“biome-forming”). In some cases, the environment that a person lives in may also cause shifts in mineral contents (i.e. water high in some mineral, living in a polluted environment). DNA may come in as a further compounding factor. Let us see what is reported in the literature:

Eating Habits

Often parents will shift diet due to beliefs or due to a child preference/resistance.

  • Children with autistic disorder showed low dietary intake of some micronutrients; calcium (Ca), magnesium (Mg), iron (Fe), selenium (Se) and sodium (Na), also they had significantly high intake of potassium (K) and vitamin C compared to healthy controls [2017]
  • Children with autism spectrum disorder consume less protein, calcium, selenium, vitamin D, thiamine, riboflavin and vitamin B12 and more polyunsaturated fat acid and vitamin E than controls. [2019]
  • These children consumed significantly fewer macronutrients compared with the children without ASD. In addition, the children with ASD had the highest rate of vitamin A deficiency,  [2016]
  • Relative to controls, ASD children consumed fewer number of food items, particularly fruits, vegetables, and proteins; had significantly lower daily intake of potassium, copper and folate. [2017]
  • ASD patients consumed in average more calories than controls (though with a high patient’s frequency above and below calorie range references), had a limited food repertoire, high prevalence of children with inadequate calcium, sodium, iron, vitamin B5, folate, and vitamin C intake. [2016]
  • Nutrients least likely to be consumed in recommended amounts were vitamin A, vitamin E, fiber, and calcium. Children with ASD were more likely to consume vitamin/mineral supplements than typically developing children. Compared with parents of typically developing children, parents of children with ASD were more likely to report that their children were picky eaters and resisted trying new foods [2008]
  • The results obtained showed that the intake of carbohydrates and slightly lower intakes of protein, fat, calcium, magnesium, phosphorus, iron, zinc, retinol, vitamin B2, vitamin B12, folic acid, and pantothenic acid were higher among children and adolescents with ASD than among those without ASD.  [2020]
  • Risk for specific inadequacies included vitamin D (97% of the sample), fiber (91%) vitamin E (83%), and calcium (71%). Children with five or more nutritional inadequacies (n=55) were more likely to make negative statements during meals (P<0.05). [2018]
  • However, high fibre intake was connected with a decreased α-diversity only in children with ASD. High carbohydrate and fibre intake influenced β-diversity, changing the abundance of Bacteroides and other genera, many of them members of the Clostidiaceae. Modulating food habits of ASD children can influence their gut microbiota composition. [2020]

Child food-resistance can be a challenge to normalizing food intake (which may result in symptom improvement because of it’s impact on the microbiome).

Hair Concentrations

The above chart used hair analysis. There is significant literature in this area:

  • By comparing hair concentration of autistic vs nonautistic children, elevated hair concentrations were noted for aluminum, arsenic, cadmium, mercury, antimony, nickel, lead, and vanadium. Hair levels of calcium, iron, iodine, magnesium, manganese, molybdenum, zinc, and selenium were considered deficient. [2012]
  • . The mean Levels of mercury, lead, and aluminum in hair of the autistic patients were significantly higher than controls. Mercury, lead, and aluminum levels were positively correlated with maternal fish consumptions, living nearby gasoline stations, and the usage of aluminum pans, respectively. [2015]
  •  The children with autism had significantly (p<0.001) higher in-hair concentration levels of lead, mercury and uranium. There was no significant difference between the two groups in the other five toxic elements.[2005]
  • Mean Calcium level in the hair of the case group was lower than the mean level of this element in the control group. Mean Arsenic and Lead concentration in the hair of children with ASD was statistically significantly higher than the mean concentration of this element in the hair of children without neurological disorders. [2020]
  •  We have also identified factors associated with concentrations of Lead in blood of children with ASD or suspected of having ASD, including dietary factors. These factors include child’s sex, parental education, exhibiting pica, and eating watermelon, lamb, and cold breakfast such as cereal. [2019]
  • Children with autism had significantly (2.1-fold) higher levels of mercury but similar levels of lead and similar levels of zinc. Children with autism also had significantly higher usage of oral antibiotics during their first 12 mo of life, and possibly higher usage of oral antibiotics during their first 36 mo of life. [2007]
  • The significant elevation in the concentration of Copper, Lead, and Mercury and significant decrease in the concentration of Magnesium and Selenium observed in the hair and nail samples of autistic subjects could be well correlated with their degrees of severity. [2011]

Risks from Minerals

  •  our findings indicated that among children with the Ile/Ile genotype, those with blood manganese concentrations > 12 μg/L had about 4 times higher odds of ASD compared to those with blood manganese concentrations <12 μg/L. [2019]
  • In the autistic groups, decreased concentration of protein in both hair and nail samples was observed…..Lower protein content and higher percentage of nitration in hair and nail of autistic children correlated with their degrees of severity. [2011]
  •  Increasing hair Mercury concentrations significantly correlated with increased ASD severity [2012]
  • In this study, it is evident that levels of mercury and copper in hair are significantly associated with higher Childhood Autism Rating Scale scores. This was supported by Adams et al. [19] who found that severity of a child’s autism coincided with the levels of toxic metals excreted in their urine after treatment with metal removal therapy; the higher the levels of antimony and other metals excreted, the more severe was the child’s autism.[2011]

Treatment

  • Treatments that could address redox metabolism abnormalities include methylcobalamin with and without folinic acid in open-label studies and vitamin C and N-acetyl-l-cysteine in DBPC studies. These studies have reported improved core and associated ASD symptoms with these treatments. [2014]
  • Dietary supplements, especially multivitamin/minerals, were used by 56% of children with ASD. The most common micronutrient deficits were not corrected (vitamin D, calcium, potassium, pantothenic acid, and choline) by supplements. Almost one-third of children remained deficient for vitamin D and up to 54% for calcium. Children receiving GFCF diets had similar micronutrient intake but were more likely to use supplements (78% vs 56%; P=0.01). Supplementation led to excess vitamin A, folate, and zinc intake across the sample, vitamin C, and copper among children aged 2 to 3 years, and manganese and copper for children aged 4 to 8 years. [2015]

Looking at the Results

Selenium (34Se), an antioxidant trace element, is an important regulator of brain function. These beneficial properties that Se possesses are attributed to its ability to be incorporated into selenoproteins as an amino acid. Several selenoproteins are expressed in the brain, in which some of them, e.g. glutathione peroxidases (GPxs), thioredoxin reductases (TrxRs) or selenoprotein P (SelP), are strongly involved in antioxidant defence and in maintaining intercellular reducing conditions. Since increased oxidative stress has been implicated in neurological disorders, including Parkinson’s disease, Alzheimer’s disease, stroke, epilepsy and others, a growing body of evidence suggests that Se depletion followed by decreased activity of Se-dependent enzymes may be important factors connected with those pathologies. 

Selenium in the Therapy of Neurological Diseases. Where is it Going? 2016

Bottom Line

While the following common is common with Autism, it does not apply to every child. Individual testing is strongly recommended.

  • High Levels of:
    • Aluminum,
    • Antimony,
    • Arsenic,
    • Cadmium,
    • Lead,
    • Mercury,
    • Nickel,
    • Vanadium
  • Low Levels of:
    • Boron,
    • Calcium,
    • Fluorine,
    • Iodine,
    • Iron,
    • Lithium,
    • Magnesium,
    • Manganese,
    • Molybdenum,
    • Selenium,
    • Strontium,
    • Zinc

Actions?

From prior readings, I know that items like Vitamin D absorption can be greatly influence by the microbiome. People take recommended dosages (which works across a typical population) and there is no significant changes. One approach is to use mega dosages. Another is to encourage bacteria known to assist absorption. For vitamin D, we know that Bifidobacterium Longum, Lactobacillus Casei and Lactobacillus Reuteri plays a role. Our knowledge is still fragmentary.

We have information on the bacteria influenced by Iron, dietary protein and a few more.

For items like aluminum being high, we have the association with aluminum cookware from the literature. We should be wary of all canned drinks because the container is aluminum and the contents are usually acidic (acid is used to extract aluminum). This also applies to items in TetraPaks(5% aluminum) which may include milk, soups.

Tetra Pak partnership targets carton polymer recovery | plasticstoday.com

Bottle waters are often no better (and sometimes worst) than tap water (2019 Consumer Reports Article).

For items like Selenium, always having a few Brazil Nuts around should address this issue. Using crude sea salt provides fluoride and iodine. A hot bed-time drink made with Cocoa powder(NOT chocolate favoring) helps with magnesium and zinc. Vanadium can be a bit of a challenge to get some kids to eat radishes, unlike molybdenum that may be obtained from potatoes.

There was a number of B-vitamins reported deficient cited above. I often refer to the B-vitamins as the Beef-Vitamins. The low protein intake would be expected to result in low levels of these. My first goal would be to increase protein intake before supplementation.

My future research

This has gotten me interested in the minerals-bacteria interaction. An area that I expect sparse information. As I find information I will post here.

ASD and Fecal Matter Transplants

FMTs have been tried for various conditions with mixed success. Autism has distinctive microbiome shifts and thus FMT should be consider as a treatment option. The why of failures has been an ongoing interest of mine. We may now have a significant factor that has been ignored in these attempts.

 Fecal microbiota transplantation (FMT) as a special organ transplant therapy, which can rebuild the intestinal flora, has raised the clinical concerns. It has been used in the refractory Clostridium difficile, inflammatory bowel disease, irritable bowel syndrome, chronic fatigue syndrome, and some non-intestinal diseases related to the metabolic disorders. But this method of treatment has not become a normal treatment, and many clinicians and patients can not accept it. 

[Research progress of fecal microbiota transplantation] 2015

This week’s Economist had an extended essay on Viruses and the like: The aliens among us/The Outsider within, this provides good background.

In addition to this, there was a podcast reporting success with FMT was associated with higher Phage Diversity in the donor. Phages are the police of the microbiome.

In this retrospective analysis, FMTs with increased bacteriophage α-diversity were more likely to successfully treat rCDI. In addition, the relative number of bacteriophage reads was lower in donations leading to a successful FMT. These results suggest that bacteriophage abundance may have some role in determining the relative success of FMT.

The success of fecal microbial transplantation in Clostridium difficile infection correlates with bacteriophage relative abundance in the donor: a retrospective cohort study (2019)

My earlier posts on FMT

Bottom Line

This implies that for a greater chance of success and less risk, than DYI fecal transfer, that a lab that tests for possible infections AND for phage state may yield the best results.

Suggestions by 2 different roads

I just pushed an update to the Special Condition Modifier page. You will see two links to suggestions on the page. See the earlier post here.

Suggestion are using published studies only
Suggestion are using machine learning from this site only

Pub Med

Citizen Science

Convergence!

There is a considerable one to one agreement with the suggestions. There is also agreement with gluten-free diet (i.e. no wheat, barley) which had positive results reported from studies (as well as B6).

In short, the microbiome analysis with suggestions appear to match actual studies — except we have more items suggested than been studied independently.

From the special condition page. Results from studies on PubMed

Implication for Specific Children

Above we are working from aggregations of many children with ASD. What is reported is not specific to one child. With an individual 16s stool sample test, then we can process that child’s unique individual microbiome profile thru and get suggestions specific for that child using the same logic as shown above.

The following 16s Providers provide data in an uploadable format. Biome Sight with “MICRO” as discount code and Thryve Alive

Low Oxygen in ASD Brains

This is usually called hypoperfusion ( Hypoperfusion is a term that describes “a reduced amount of blood flow”. ) and is seen in SPECT scans of the brain. I am experienced with it from episodes of ME/CFS relapse (SPECT scan reports) that had poor memory, poor decision making, easy mental fatigue, increased irritability during the relapse. It is my belief that metabolic changes induced by microbiome dysfunction was the cause of hypoperfusion.

There are some interesting similarities between CFS/ME and ASD, for example:

  • CFS/ME has increased Gray Brain Matter and decreased White Brain matter [2017]
  • ASD Has increased Gray Brain Matter [2006]

Literature on Autism and hypoperfusion

Treating Hypoperfusion

For ME/CFS, my treatment included sublingual heparin, piracetam and a variety of other items. Below are studies on various items that impacts hypoperfusion.

Possible Prescription Drugs

Low level coagulation as a contributor to hypoperfusion

For myself with ME/CFS, activation of coagulation was a significant factor and confirmed by labs tests from Hemex (this battery of tests is still available from one lab). Blood flow to the brain can be caused by:

  1. ‘thick blood'(think of a heavy oil(molasses) versus a light oil (water), one moves much slower than the other). Since blood delivers oxygen, it means less oxygen
  2. fibrin fibers (‘dirty filters’ that slows the slow, a blood clot would stop the flow)

What do we know from the literature on coagulation and autism?

Most of these issues are replicated in findings with ME/CFS (see links on this page: https://me-pedia.org/wiki/David_Berg).

There are many dimensions here, researched items that I have used include:

Bottom Line

In doing this post it was a bit of a surprise to see that 1st degree relatives was seen with similar conditions. For myself, it was not because I have an inherited coagulation defect (Prothrombin G20210A a.k.a. Factor II Mutation) so 1st degree relatives having it is to be expected.

The role of the microbiome and diet for hypoperfusion is not well explore. Emerging Role of Diet and Microbiota Interactions in Neuroinflammation [2018] gives an overview, but implications for hypoperfusion in autism is a to be determined.

This is an EDUCATIONAL POST, the items discussed above (including supplements) should be discussed with your medical professional before starting. This is not medical advice.